Wijmo Olap Architecture
Pivot tables are one of Excel's most powerful features. They allow you to explore large, detailed data sets and detect important trends and relations.
Wijmo's wijmo.olap module allows you to add this functionality to your JavaScript applications.
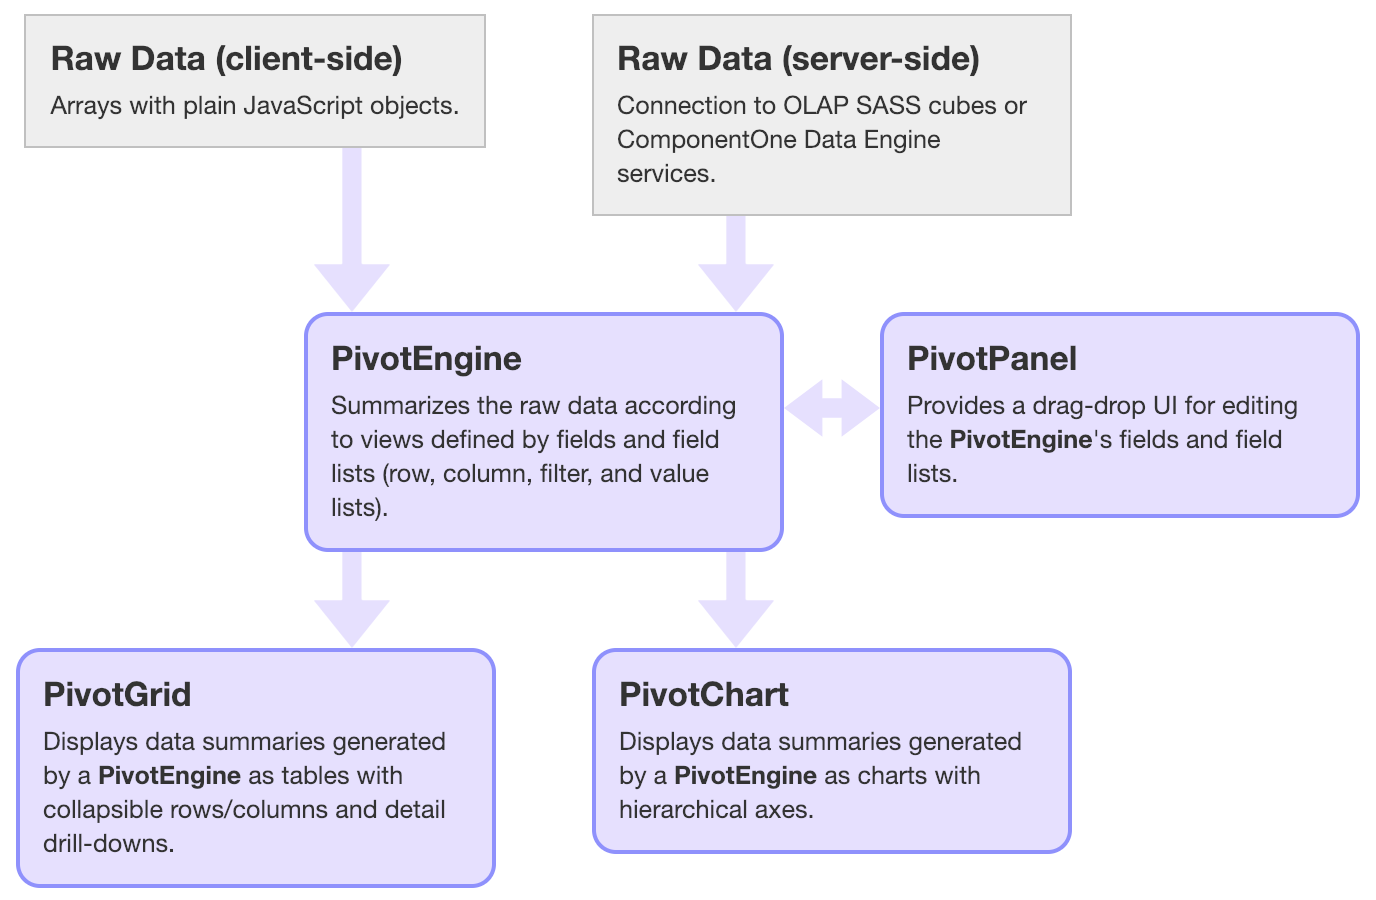
The diagram below shows the relationships between the four main classes in the wijmo.olap module:

The PivotEngine component is the core component in the wijmo.olap module. It takes raw data and creates summary views based on field lists (there are value, row, column, and filter lists). The server can use local data or connect to servers such as OLAP SASS cubes.
The PivotPanel control allows users to see and edit view definitions being used by a PivotEngine. The control shows a list of fields that can be dragged to row, column, value, or filter areas, like in Excel. When users modify the view definition, the engine automatically updates the output data summary.
View definitions can also be created and modified by using the PivotEngine's object model directly.
The PivotGrid and PivotChart controls display the output data summaries generated by the PivotEngine. Both controls allow you to export the results to PDF or XLSX.
We think you will like wijmo.olap because of its:
- Excel Compatibility: Anyone who knows how to create pivot tables in Excel will feel at home with wijmo.olap.
- Flexibility: You can combine the controls in wijmo.olap and configure them to build whatever UI you want. And you can work with data on the client or on the server.
- Power: wijmo.olap controls are fast. You can summarize hundreds of thousands of records in fractions of a second, without blocking the UI. And it supports server-based engines as well.
- Ease of Use: Create and edit views by manipulating field objects and lists they belong to. Changes are automatically reflected on all controls bound to the same engine.
- Integration: The wijmo.olap controls extend Wijmo core controls including the FlexGrid and FlexChart, and automatically inherit their rich object models, documentation, and new features as they are added.
- Support: Many features in wijmo.olap were implemented as a result of user suggestions, which are always welcome.
Configuring OLAP in your Application
In modern web applications, you may import the wijmo.olap module using HTML Imports like this:
import * as wjOlap from '@grapecity/wijmo.olap';
This will load all Module classes in wijmo.olap. If you don't need all of the OLAP controls, you can import just what you need.
import { PivotEngine, PivotGrid } from '@grapecity/wijmo.olap';
If you are using ES5, you can load wijmo using the script tags:
<script src="../scripts/controls/wijmo.olap.min.js"></script>
