Plot Areas in FlexChart
By default, each FlexChart has two axes and a single Plot Area.
You may create additional plot areas and stack them vertically or horizontally. Vertically stacked plot areas usually have their own Y axis and a shared X axis. The legend is shared by all plot areas.
To create a chart with 2 series on 2 separate plot areas, follow these steps:
- Create the FlexChart with multiple series.
- Define each plot area and add it to the chart's plotAreas collection.
- Define the necessary extra axes and assign them to the 2nd plot area by setting the plotArea property.
- Assign at least one series to the 2nd plot area by setting its axisY or axisX property to the axis you defined in step #3.
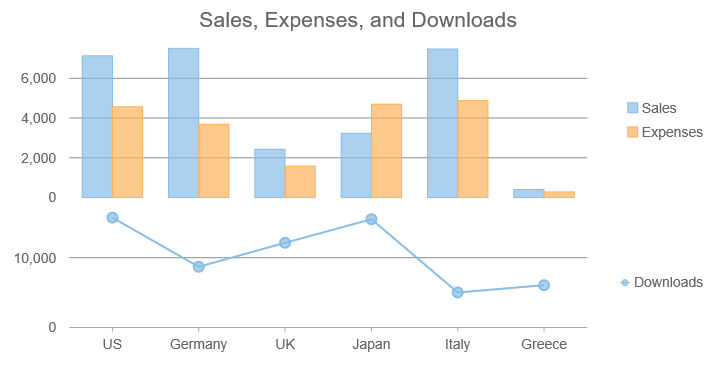
For example, the snippet below creates two plot areas. The first contains two series and show amounts on the Y axis. The second contains a single series and shows quantities on the Y axis.
import * as chart from '@grapecity/wijmo.chart';

// create the chart
var myChart = new chart.FlexChart('#myChart', {
    itemsSource: getData(),
    bindingX: 'country',
    series: [
        { binding: 'sales', name: 'Sales' },
        { binding: 'expenses', name: 'Expenses' },
        { binding: 'downloads', name: 'Downloads', chartType: 'LineSymbols' }
        ]
        });

// define first plot area, add to chart
var p = new chart.PlotArea();
p.row = 0;
p.name = 'amounts';
p.height = '2*';
myChart.plotAreas.push(p)

// define second plot area
p = new chart.PlotArea();
p.row = 1;
p.name = 'quantities';
p.height = '*';

// define second y axis
var axisY2 = new chart.Axis(wijmo.chart.Position.Left);
// assign 2nd Y axis to 2nd plot area
axisY2.plotArea = p;
// assign 3rd series 'downloads' to the 2nd Y axis
myChart.series[2].axisY = axisY2;
myChart.plotAreas.push(p);
Note that the plot area in which a series is plotted is determined by which X or Y axis the series is plotted against. So if you move an axis to a different plot area, the series will move with them.
Understanding the Plot Area Layout
The plot area layout is based on a grid layout of rows and columns. For example, to create 3 vertically stacked plot areas, set the row property for each to 0, 1 and 2 respectively.
To create 3 horizontally stacked plot areas, set the column property for each to 0, 1 and 2 respectively. You can even use both rows and columns to create a 2 x 2 layout.
You can control the size of each plot area by setting its width and height properties. If you want to add some extra space between plot areas, add an empty one to act as a spacer.
// create a spacer plot area
p = new chart.PlotArea();
p.row = theChart.plotAreas.length;
p.name = 'spacer';
p.height = 25;
theChart.plotAreas.push(p)
Stacking Multiple Charts Using Plot Margin
Stacking chart controls is an alternative to creating a single chart with multiple plot areas. Use the plotMargin property to ensure the charts line up properly.
For example, these two charts stacked vertically have their Y axes aligned by setting both plotMargin properties to have '120' as the left value.
myChart1.plotMargin = 'NaN 120 10 60'; // top, right, bottom, left
myChart2.plotMargin = '10 120 NaN 60'; // top, right, bottom, left