Syling Series in FlexChart
The FlexChart automatically picks colors for each series based on a default palette, which you can override by setting the palette property. But you can also override the default settings by setting the style property of any series to an object that specifies SVG styling attributes, including fill, stroke, strokeThickness, and so on.
The Series.style property is an exception to the general rule that all styling in Wijmo is done through CSS. The exception reflects the fact that many charts have dynamic series, which would be impossible to style in advance. For example, a stock chart may show series selected by the user while running the application.
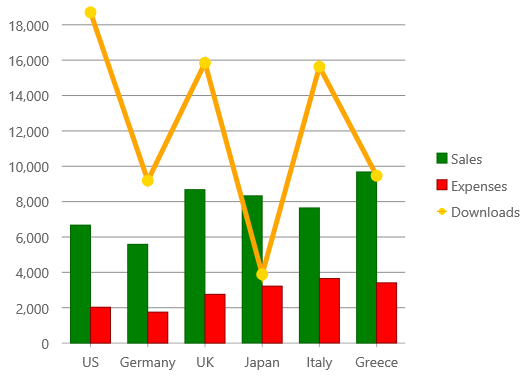
The chart in this example uses the style and symbolStyle properties to select style attributes for each series:
import * as chart from '@grapecity/wijmo.chart';

var myChart = new chart.FlexChart('#myChart', {
    itemsSource: appData,
    bindingX: 'country',
    series: [
        {
            name: 'Sales',
            binding: 'sales',
            style: {
                fill: 'green',
                stroke: 'darkgreen',
                strokeWidth: 1
            }
        },
        {
            name: 'Expenses',
            binding: 'expenses',
            style: {
                fill: 'red',
                stroke: 'darkred',
                strokeWidth: 1
            }
        },
        {
            name: 'Downloads',
            binding: 'downloads',
            chartType: 'LineSymbols',
            style: {
                stroke: 'orange',
                strokeWidth: 5
            },
            symbolStyle: {
                fill: 'gold',
                stroke: 'gold'
            }
        }
    ]
});
Alternate Style
he altStyle (alternative style) is used for negative values in Bar, Column, and Scatter charts; and for rising values in financial chart types like Candlestick, LineBreak, EquiVolume etc. By default, the altStyle is null and uses the default style.
Example:
myChart.series[0].style = {
    fill:'green',
    stroke:'darkgreen',
    strokeWidth: 1};

myChart.series[0].altStyle = {
    fill:'red',
    stroke:'darkred',
    strokeWidth: 1};
Using Gradient Colors
The FlexChart supports gradient colors. The gradient descriptor is an expression formatted as follows:
<type>(<coords>)<colors>[:<offset>[:<opacity>]][-<colors>[:<offset>[:<opacity>]]]-<colors>[:<offset>[:<opacity>]].
The type can be either linear or radial. The uppercase L or R letters indicate absolute coordinates offset from the SVG surface. Lowercase l or r letters indicate coordinates calculated relative to the element to which the gradient is applied. Coordinates is a set of three or four numbers that specify a linear gradient vector as x1, y1, x2, y2, or a radial gradient as cx, cy, r and optional fx, fy, fr specifying a focal point away from the center of the circle. Specify colors as a list of dash-separated CSS color values. Each color may be followed by a custom offset and opacity value, separated with a colon character.
Linear gradient format example:
'l(0,0,1,0)#ff0000-#00ff00-#0000ff', 'L(0,0,300,300)#ff0000:0.2:0.2-00ff00:0.8'
Radial gradient format example:
'r(0.5,0.5,1)#ff0000-#0000ff', 'R(100,100,100,200,200,200)#ff0000-#0000ff'
JavaScript examples setting the style to a gradient:
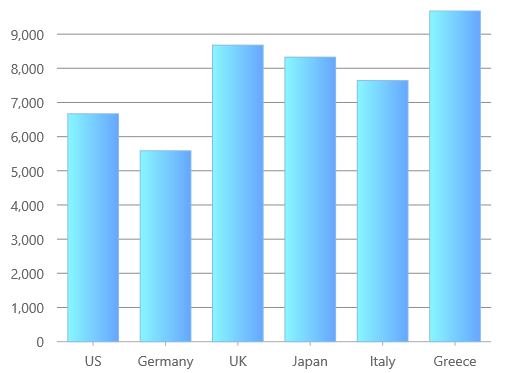
// light blue gradient
myChart.series[0].style = {
    fill: 'l(0,0,1,0)#89f7fe-#66a6ff'
};
myChart.refresh(true);
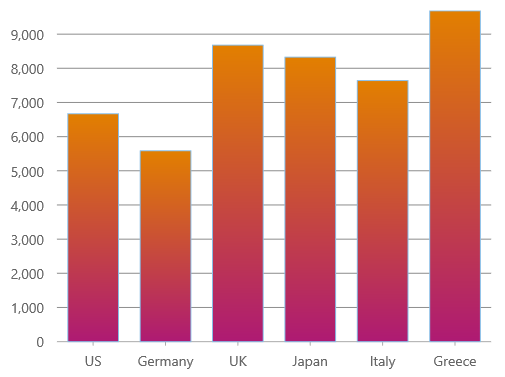
// orange gradient
myChart.series[0].style = {
    fill: 'l(0,0,0,1)#e27f00-#ae1a73'
};
myChart.refresh(true);