5.20231.904
5.20231.904
Custom Functions
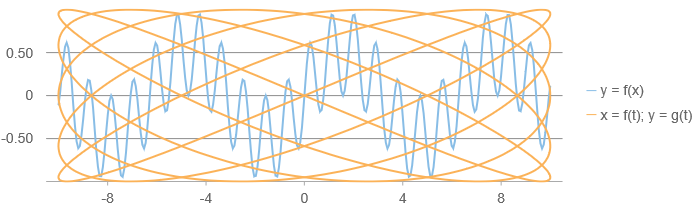
The wijmo.chart.analytics module contains two classes that allow you to plot arbitrary functions without explicitly generating data points:
- YFunctionSeries: Series based on a function that provides Y values as a function of X values within a given range.
- ParametricFunctionSeries: Series based on functions that provides X and Y values as a function of domain values within a given range.
Example:
import * as chart from '@grapecity/wijmo.chart';
import * as analytics from '@grapecity/wijmo.chart.analytics';

// create a YFunctionSeries and add it to the chart
var yFun = new analytics.YFunctionSeries();
yFun.name = 'y = f(x)';
yFun.min = -10;
yFun.max = 10;
yFun.sampleCount = 300;
yFun.func = function (x) {
    return Math.sin(4 * x) * Math.cos(3 * x);
    };
myChart.series.push(yFun);

// create a ParametricFunctionSeries and add it to the chart
var pFun = new analytics.ParametricFunctionSeries();
pFun.name = 'x = f(t); y = g(t)'
pFun.min = 0;
pFun.max = 2 * Math.PI;
pFun.sampleCount = 1000;
pFun.xFunc = function (t) {
    return 10 * Math.cos(5 * t);
    };
pFun.yFunc = function (t) {
    return Math.sin(6 * t);
    };
myChart.series.push(pFun);
}