Bubble Charts with FlexChart
Most chart types require that you provide a binding property to define the name of the property being charted. These types include Column, Bar, Scatter, Line, Area, and Spline.
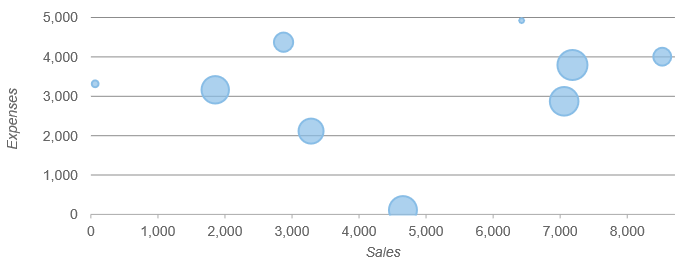
A few chart types require additional information. For example, Bubble charts type requires an additional value to determine the bubble size.
In these cases, the binding property should be set to a comma-delimited string containing the names of all the properties to be used for creating the chart. The data for this chart type can be defined using the FlexChart or Series binding property as a comma separated value in the following format: "yProperty, bubbleSizeProperty".
For example, the example below sets the binding property of its series to 'expenses,downloads', so the expenses are used as Y values and downloads determine the bubble size:
import * as chart from '@grapecity/wijmo.chart';

// create the bubble chart
var myChart = new chart.FlexChart('#myChart', {
    itemsSource: getData(),
    chartType: 'Bubble',
    bindingX: 'sales',
    series: [
        { binding: 'expenses,downloads' }
    ]
});
Controlling the Min and Max Bubble Size
The variable bubble size is based upon the binding field, however you can control the largest and smallest size the bubbles will render. The following options are supported:
- bubble.maxSize: Specifies the maximum size of symbols in the Bubble chart. The default value is 30 pixels.
- bubble.minSize: Specifies the minimum size of symbols in the Bubble chart. The default value is 5 pixels.
Example:
myChart.options = {
  bubble: {
      minSize: 5,
      maxSize: 30
      }
}