TreeMap
Use the wijmo.chart.hierarchical.TreeMap control to create TreeMaps. This topic includes features specific to TreeMaps. For common features such as data labels, export, palette and styling you can refer to the other topics within the chart module.
Getting Started with Wijmo TreeMap
Here are the steps for getting started with the TreeMap control in JavaScript applications:
- Add references to Wijmo.
- Add markup to serve as the Wijmo control's host.
- Initialize the TreeMap control via JavaScript.
HTML Example:
<div id="myChart"></div>
JavaScript Example:
import * as hierarchical from '@grapecity/wijmo.chart.hierarchical';

var myChart = new hierarchical.TreeMap('#myChart', {
    binding: 'sales',
    bindingName: ['category', 'subCategory'],
    itemsSource: getData(),
    dataLabel: {
        position: 'Center',
        content: '{name}'
    }
});
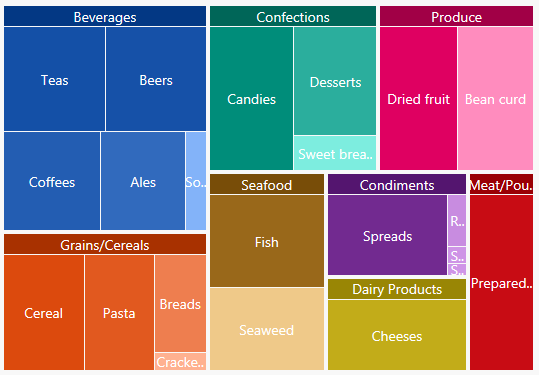
TreeMap Data Binding
The data binding for TreeMap is slightly different than FlexChart, and more similar to FlexPie.
The binding property is used to calculate the size of the node as compared to other node values. The property should contain numeric data.
The bindingName property is used to show name of the node. It should be an array or a string.
Using Grouped Data Sources
You can use the TreeMap chart with grouped CollectionView data sources. For example, if a CollectionView has two group descriptors: "category" and "subCategory", this can be bound to TreeMap using an array for the bindingName.
myChart.bindingName = ['category', 'subCategory'];
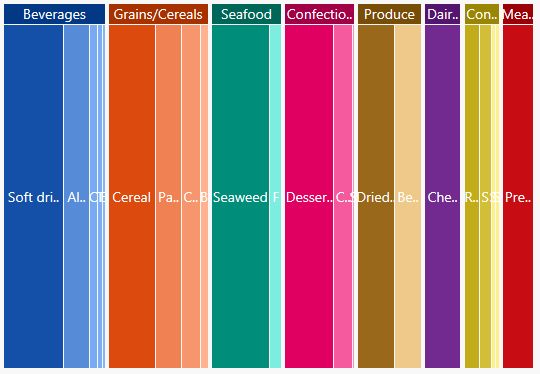
Horizontal and Vertical TreeMaps
The type property specifies the type of the TreeMap control (Squarified, Horizontal, or Vertical).
Example:
import * as hierarchical from '@grapecity/wijmo.chart.hierarchical';

var typeChart = new hierarchical.TreeMap('#typeChart', {
    binding: 'sales',
    bindingName: ['category', 'subCategory'],
    type: 'Vertical',
    itemsSource: getData(),
    dataLabel: {
        position: 'Center',
        content: '{name}'
    }
});
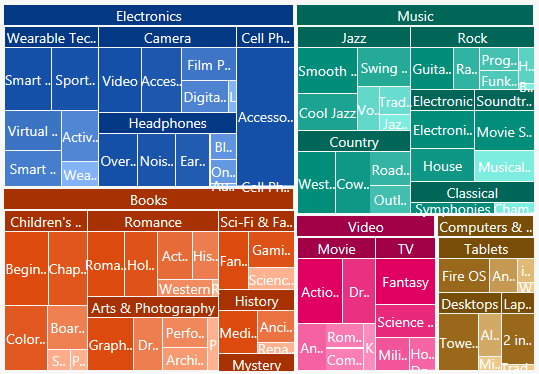
Hierarchical TreeMaps
Use the childItemsPath property to set the name of the property (or properties) used to generate child items in hierarchical data. Set this property to an array containing the names of the properties that contain child items at each level, when the items are child items at different levels with different names (e.g. [ 'accounts', 'checks', 'earnings' ]).
The maxDepth property specifies the maximum number of node levels to show in the current view. In the example below the maxDepth is set to '3' so it means that the TreeMap visualizes just the first 3 levels (ie, Music > Country > Classic Country). If we set it to '2' then the TreeMap will only visualize two levels (ie, Music > Country).
Hierarchical Example:
import * as hierarchical from '@grapecity/wijmo.chart.hierarchical';

var myChart = new hierarchical.TreeMap('myChart', {
        binding: 'sales',
        bindingName: 'type',
        childItemsPath: 'items',
        maxDepth: 2,
        itemsSource: getHierarchicalData(),
        dataLabel: {
            position: 'Center',
            content: '{name}'
        }
});

function getHiearchicalData() {
    var data = [
        {
            type: 'Music', items: [
                {
                    type: 'Country', items: [
                        { type: 'Classic Country', sales: 50 },
                        { type: 'Cowboy Country', sales: 50 },
                        { type: 'Outlaw Country', sales: 50 }
                    ]
                },
                {
                    type: 'Rock', items: [
                        { type: 'Hard Rock', sales: 50 },
                        { type: 'Blues Rock', sales: 50 }
                    ]
                },
                {
                    type: 'Classical', items: [
                        { type: 'Symphonies', sales: 50 },
                        { type: 'Chamber Music', sales: 50 }
                    ]
                }
            ]
        },
        {
            type: 'Video', items: [
                {
                    type: 'Movie', items: [
                        { type: 'Comedy', sales: 50 },
                        { type: 'Drama', sales: 50 },
                        { type: 'Romance', sales: 50 }
                    ]
                },
                {
                    type: 'TV', items: [
                        { type: 'Science Fiction', sales: 50 },
                        { type: 'Documentary', sales: 50 },
                        { type: 'Fantasy', sales: 50 },
                        { type: 'Horror', sales: 50 }
                    ]
                }
            ]
        }
    ];
    return data;
}
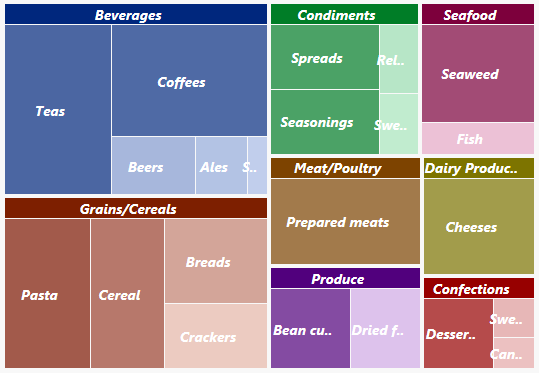
TreeMap Color Palette
The palette property determines the colors used in the chart. The array contains strings that represent CSS colors. For example:
// use colors specified by name
myChart.palette = ['red', 'green', 'blue'];

// or use colors specified as rgba-values
myChart.palette = [
  'rgba(255,0,0,1)',
  'rgba(255,0,0,0.8)',
  'rgba(255,0,0,0.6)',
  'rgba(255,0,0,0.4)'];
The TreeMap control supports a color range for each group. This allows each group to remain themed to a single color group.
myChart.palette = [
    { titleColor: '#00277d', maxColor: 'rgba(0,39,125,0.7)', minColor: 'rgba(168,187,230,0.7)' },
    { titleColor: '#7d1f00', maxColor: 'rgba(125,21,0,0.7)', minColor: 'rgba(230,183,168,0.7)' },
    { titleColor: '#007d27', maxColor: 'rgba(0,125,39,0.7)', minColor: 'rgba(168,230,188,0.7)' },
    { titleColor: '#7d003c', maxColor: 'rgba(125,0,60,0.7)', minColor: 'rgba(230,168,198,0.7)' },
    { titleColor: '#7d4300', maxColor: 'rgba(125,67,0,0.7)', minColor: 'rgba(230,201,168,0.7)' },
    { titleColor: '#51007d', maxColor: 'rgba(81,0,125,0.7)', minColor: 'rgba(209,170,230,0.7)' },
    { titleColor: '#7d7400', maxColor: 'rgba(125,116,0,0.7)', minColor: 'rgba(230,226,168,0.7)' },
    { titleColor: '#970000', maxColor: 'rgba(151,0,0,0.7)', minColor: 'rgba(230,169,169,0.7)' }
    ]