Gridlines & Tickmarks in FlexChart
By default, the FlexChart uses horizontal lines to show the x-axis and major gridlines along the y-axis. This makes charts clean and easy-to-read.
You can change this by modifying the axisX and axisY properties. The major gridlines and tick marks are drawn at each major unit. Minor gridlines and minor tick marks are drawn in between each major unit. By default only one minor gridline and tick mark is drawn between each major unit.
- majorGrid: Indicates whether to show major gridlines on the axis (true or false).
- majorTickMarks: Indicates the location of the major tick marks (Inside, Outside, Cross or None).
- minorGrid: Indicates whether to show minor gridlines on the axis (true or false).
- minorTickMarks: Indicates the location of the major tick marks (Inside, Outside, Cross or None).
To configure the frequency of gridlines & tick marks set the majorUnit and minorUnit properties. Additionally, set the axisLine (boolean) property to control the visiblity of the axis line itself.
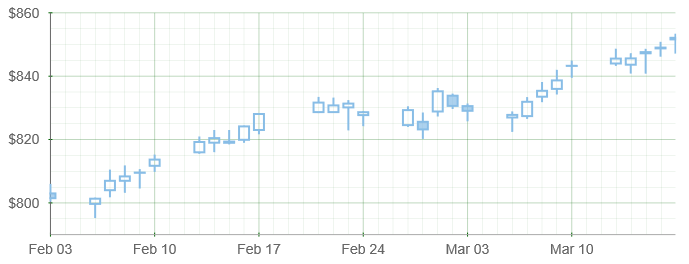
This example shows how you create and control major and minor gridlines along both axes, and how to customize them using CSS.
import * as chart from '@grapecity/wijmo.chart';

var myChart = new chart.FlexChart('#myChart');
// configure gridlines & tick marks on X axis
myChart.axisX.majorGrid = true; // show major gridlines
myChart.axisX.majorTickMarks = 'Cross'; // None,Outside,Inside,Cross
myChart.axisX.majorUnit = 7;
myChart.axisX.minorGrid = true; // show minor gridlines
myChart.axisX.minorTickMarks = 'None'; // None,Outside,Inside,Cross
myChart.axisX.minorUnit: 1;

// configure gridlines & tick marks on Y axis
myChart.axisY.axisLine = true; // show Y axis line
myChart.axisY.majorGrid = true; // show major gridlines
myChart.axisY.majorTickMarks = 'Cross'; // None,Outside,Inside,Cross
myChart.axisY.majorUnit = 20;
myChart.axisY.minorGrid = true; // show minor gridlines
myChart.axisY.minorTickMarks = 'None'; // None,Outside,Inside,Cross
myChart.axisY.minorUnit: 5;
Gridline & Tick Mark CSS
Customize the gridline & tick mark appearance through CSS using the .wj-tick and .wj-gridline classes.
Example:
.wj-flexchart {
  height: 300px;
}
.custom-gridlines.wj-flexchart .wj-axis-x .wj-tick,
.custom-gridlines.wj-flexchart .wj-axis-y .wj-tick {
    stroke: darkgreen;
}
.custom-gridlines.wj-flexchart .wj-axis-x .wj-gridline,
.custom-gridlines.wj-flexchart .wj-axis-y .wj-gridline {
    opacity: .25;
    stroke: darkgreen;
    stroke-width: 1px;
}
.custom-gridlines.wj-flexchart .wj-axis-x .wj-gridline-minor,
.custom-gridlines.wj-flexchart .wj-axis-y .wj-gridline-minor {
    opacity: .25;
    stroke: darkgreen;
    stroke-dasharray: 0;
    stroke-width: .25px;
}

.wj-control {
  margin-bottom: 6px;
}
body {
  margin-bottom: 24pt;
}
HTML
<div id="myChart" class="custom-gridlines"></div>