Moving Average
The wijmo.chart.analytics module contains classes that extend the Series class to provide extra information about the data including: trend lines, moving averages, error bars, box and waterfall plots, and function plots.
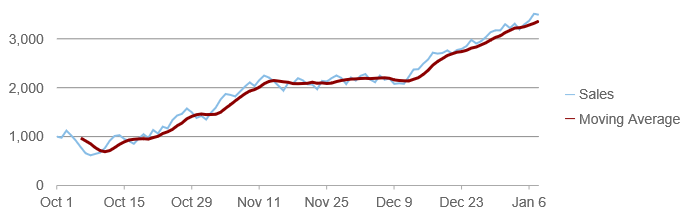
The MovingAverage class extends the regular Series class to provide a series of averages of different subsets of the full data set.
To add moving averages to a chart, follow these steps:
- Create one or more MovingAverage series,
- Configure the MovingAverage series as you would regular series, setting their binding, chartType, and style properties for example, and
- Set the MovingAverage's type and period properties to determine the type of moving average you want to create.
Example:
import * as chart from '@grapecity/wijmo.chart';
import * as analytics from '@grapecity/wijmo.chart.analytics';

// create a MovingAverage and add it to the Chart series collection
var movingAvg = new analytics.MovingAverage();
movingAvg.name = 'Moving Average';
movingAvg.itemsSource = myChart.itemsSource;
movingAvg.binding = 'sales';
movingAvg.type = 'Simple';
movingAvg.period = 6;
movingAvg.style = { stroke: 'darkred', strokeWidth: 3 };
myChart.series.push(movingAvg);
Supported moving average types:
- Simple: An average of the last n values.
- Weighted: Weighted average of the last n values, where the weight decreases by 1 with each previous value.
- Exponential: Weighted average of the last n values, where the weight decreases exponentially with each previous value.
- Triangular: Weighted average of the last n values, whose result is equivalent to a double smoothed simple moving average.
Display Options for Moving Averages
The MovingAverage class is supported like a series in FlexChart. You can choose whether or not the line displays an entry in the legend by setting the visibility property to one of the following:
Visible: The series is visible on the plot and in the legend.
Plot: The series is visible only on the plot.
Legend: The series is visible only in the legend.
Hidden: The series is hidden.
The legend text is set using the name property of the series.