Box & Whisker Series
The wijmo.chart.analytics module contains classes that extend the Series class to provide extra information about the data including: trend lines, moving averages, error bars, box and waterfall plots, and function plots.
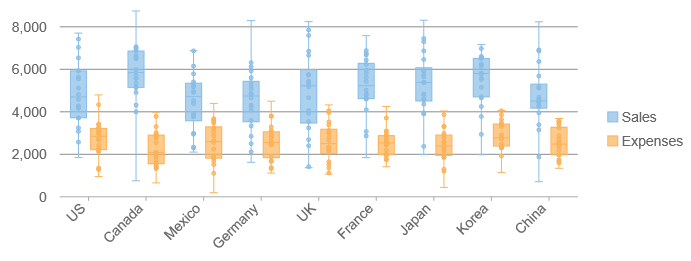
Box & Whisker charts (AKA boxplots) are normally used to compare distributions between different sets of numerical data. The box and whiskers show groups of numerical data through their quartiles. They have lines extending vertically from the boxes (whiskers) indicating variability outside the upper and lower quartiles.
To create a Box and Whisker chart, follow these steps:
- Create one or more BoxWhisker series objects,
- Configure the BoxWhisker series by setting their name and binding properties (they should be bound to properties that contain number arrays), and
- Set additional properties such as groupWidth and gapWidth if you want to fine-tune the display.
import * as chart from '@grapecity/wijmo.chart';
import * as analytics from '@grapecity/wijmo.chart.analytics';

// create BoxWhisker series for 'sales' and add it to the chart
var sales = new analytics.BoxWhisker();
sales.name = 'Sales';
sales.binding = 'sales';
sales.groupWidth = .7;
sales.gapWidth = .2;
sales.showInnerPoints = true,
myChart.series.push(sales);
Additional Box & Whisker Options
Set these additional properties to fine-tune the display.
- gapWidth: The width of the gap between groups as a percentage. The default value is 0.1. The min value is 0 and max value is 1.
- groupWidth: The box group width as a percentage. The default value for this property is 0.8. The min value is 0 and the max value is 1.
- QuartileCalculation: Specifies the quartile calculation method. Options include InclusiveMedian and ExclusiveMedian, which includes or excludes the median value when calculating the quartile.
- showMeanLine: Determines whether to show the mean line.
- showMeanMarker: Determines whether to show the mean marker.
- showOutliers: Determines whether to show outliers. Outliers are inner points outside the range between the first and third quartiles.
Styling the Box & Whisker Series
The BoxWhisker series supports the same style option as other series in FlexChart. In addition to style, BoxWhisker includes some special style properties for the mean line and markers.
import * as chart from '@grapecity/wijmo.chart';
import * as analytics from '@grapecity/wijmo.chart.analytics';

var sales = new analytics.BoxWhisker();
sales.name = 'Sales';
sales.binding = 'sales';
sales.meanLineStyle = {
    stroke:'darkgreen',
    strokeWidth: 1};
sales.meanMarkerStyle = {
    fill:'red',
    stroke:'darkred',
    strokeWidth: 1};
myChart.series.push(sales);