5.20231.904
Line Markers in FlexChart
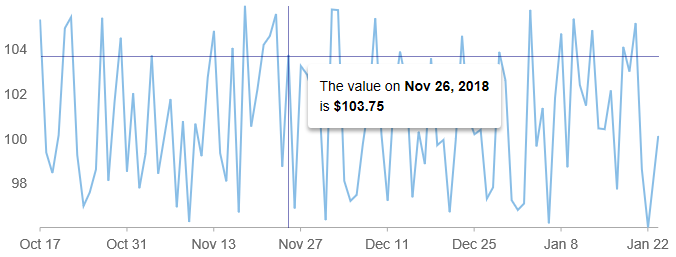
The LineMarker class allows you to add a mouse-driven cursor to your charts. The cursor consists of a text element used to display information about the point under the mouse and optional lines (crosshairs) to indicate the exact position of the mouse.

You can customize the LineMarker behavior using properties including content, interaction, and lines.
The interaction property determines how the user interacts with the line marker. It can be static (interaction = None), follow the mouse or touch position (interaction = Move), or move when the user drags the line (interaction = Drag).
Example:
import * as chart from '@grapecity/wijmo.chart';

// create an interactive marker with a horizontal line and y-value
  var lineMarker = new chart.LineMarker($myChart, {
      lines: wijmo.chart.LineMarkerLines.Horizontal,
      interaction: wijmo.chart.LineMarkerInteraction.Move,
      alignment : wijmo.chart.LineMarkerAlignment.Top
  });
  lineMarker.content = function (ht) {
      // show y-value
      return ht.y.toFixed(2);
  }
Display rich formatted content within the line marker by using the wijmo.format method.
lineMarker.content = function (ht) {
    return ht.item ? wijmo.format('The value on <b>{date:MMM d, yyyy}</b><br/>is <b>{value:c}</b>', ht.item) : 'No items here...';
    }
    });
You can customize the appearance of the LineMarker using CSS.
.wj-flexchart .wj-chart-linemarker {
  background: transparent;
}
.wj-chart-linemarker-content {
  padding: 12px;
  margin: 6px;
  background: white;
  border-radius: 3px;
  box-shadow: 0 3px 6px rgba(0,0,0,0.16), 0 3px 6px rgba(0,0,0,0.23);
}
.wj-flexchart .wj-chart-linemarker .wj-chart-linemarker-hline,
.wj-flexchart .wj-chart-linemarker .wj-chart-linemarker-vline {
  height: 1px;
  width: 1px;
  opacity: .5;
  background: navy;
}
