5.20231.904
5.20231.904
Range Selectors in FlexChart
Range selectors allow users to zoom in on selected parts of a chart by selecting a range on a secondary chart. The most popular implementation is the one in Google Finance charts.
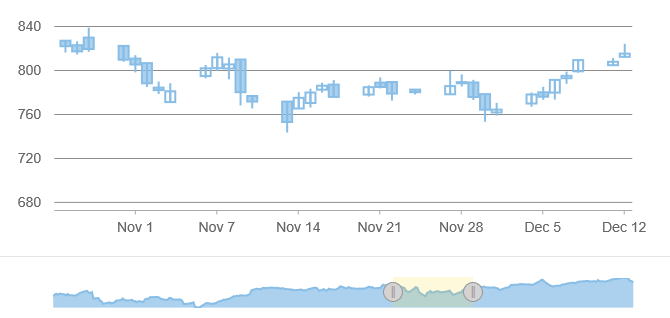
The RangeSelector class in the wijmo.chart.interaction module makes it easy to add range selectors FlexChart:
- Start with a regular FlexChart.
- Add a second FlexChart below the main chart, remove both axes and set the height to a small value (say 60px).
- Create a RangeSelector object using the second chart as the constructor's parameter.
- Listen to the RangeSelector's rangeChanged event to update the main chart's X-axis range.
import * as chart from '@grapecity/wijmo.chart';
import * as interaction from '@grapecity/wijmo.chart.interaction';

// create the regular chart
var regularChart = new chart.FlexChart('#regularChart', {
    plotMargin: 'NaN 60 NaN 60' // top, right, bottom, left
});

// create the second chart for the range selector
var secondChart = new chart.FlexChart('#secondChart', {
    plotMargin: 'NaN 60 NaN 60' // top, right, bottom, left
});

// create RangeSelector
var rangeSelector = new interaction.RangeSelector(secondChart, {
    max: regularChart.itemsSource[0].date.valueOf(), // now
    min: regularChart.itemsSource[30].date.valueOf(), // a month ago
        minScale: .05, // restrict selection to between 5% and
        maxScale: .75, // 75% of the data
      rangeChanged: function(s, e) {
        regularChart.axisX.min = s.min;
      regularChart.axisX.max = s.max;
    }
});