Trend Lines
The wijmo.chart.analytics module contains classes that extend the Series class to provide extra information about the data including: trend lines, moving averages, error bars, box and waterfall plots, and function plots.
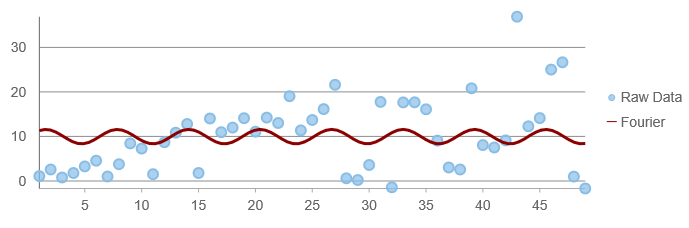
The TrendLine class extends the regular Series class to provide a calculated series based on the data and parameters you select. There are several types of trendlines supported, including regression trendlines such as polynomial, exponential, logarithmic, power and Fourier functions that approximate the data which the functions trend. It also supports some non-regression trend lines such as linear, minimum, maximum, and average which draw a straight line.
To add trend lines to a chart, follow these steps:
- Create one or more TrendLine objects,
- Configure the TrendLine objects as you would a regular series, setting their binding, chartType, and style properties for example, and
- Set the TrendLine's fitType and order properties to determine the type of trend line you want to create. Note that the order property only applies to Fourier and Polynomial types.
Example:
import * as chart from '@grapecity/wijmo.chart';
import * as analytics from '@grapecity/wijmo.chart.analytics';

// create a TrendLine and add it to the Chart series collection
var trendLine = new analytics.TrendLine();
trendLine.binding = 'y';
trendLine.style = { stroke: 'darkred', strokeWidth: 3 };
trendLine.fitType = 'Fourier';
trendLine.name = 'Fourier';
trendLine.order = 3;
trendLine.visibility = 'Visible';
myChart.series.push(trendLine);
Supported Fit Types:
- Linear: A straight line that most closely approximates the data. Y(x) = a *x + b.
- Exponential: Regression fit to the equation Y(x) = a * exp(b*x).
- Logarithmic: Regression fit to the equation Y(x) = a * ln(x) + b.
- Power: Regression fit to the equation Y(x) = a * pow(x, b).
- Fourier: Regression fit to the equation Y(x) = a + b * cos(x) + c * sin(x) + d * cos(2*x) + e * sin(2*x) + …
- Polynomial: Regression fit to the equation Y(x) = a * x^n + b * x^n-1 + c * x^n-2 + … + z.
- MinX: The minimum X-value.
- MinY: The minimum Y-value.
- MaxX: The maximum X-value.
- MaxY: The maximum Y-value.
- AverageX: The average X-value.
- AverageY: The average Y-value.
Display Options for Trend Lines
The TrendLine class is supported like a series in FlexChart. You can choose whether or not the trendline displays an entry in the legend by setting the visibility property to one of the following:
Visible: The series is visible on the plot and in the legend.
Plot: The series is visible only on the plot.
Legend: The series is visible only in the legend.
Hidden: The series is hidden.
The legend text is set using the name property of the trendline series.
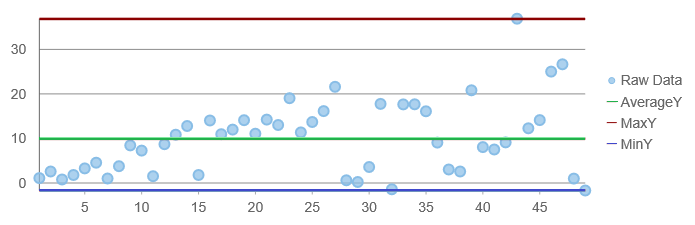
Displaying a Reference Line for Min, Max, or Average
The FlexChart TrendLine can be used to display a static, reference line at the calculated min, max or average value based upon the data set. Set the fitType to MinX, MinY, MaxX, MaxY, AverageX, or AverageY depending on which axis and value you want to display.