Error Bars
The wijmo.chart.analytics module contains classes that extend the Series class to provide extra information about the data including: trend lines, moving averages, error bars, box and waterfall plots, and function plots.
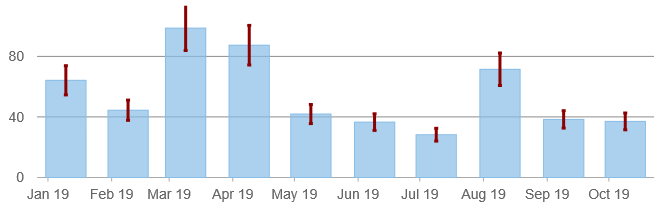
The ErrorBar class extends the regular Series class to provide error bars that can be added on top of the regular series data.
To create a series with error bars, follow these steps:
- Create an ErrorBar series,
- Configure the ErrorBar series as you would regular series, setting their binding, chartType, and style properties for example, and
- Set the ErrorBar's value and errorAmount properties which determine the size of the error bars to be added to the data points.
Example:
import * as chart from '@grapecity/wijmo.chart';
import * as analytics from '@grapecity/wijmo.chart.analytics';

// create an ErrorBar series for 15% and add it to the Chart
var errorBar = new analytics.ErrorBar();
errorBar.binding = 'amount';
errorBar.chartType = 'Column';
errorBar.value = 0.15;
errorBar.errorAmount = 'Percentage';
myChart.series.push(errorBar);
Supported chart types for error bars:
- Column
- Bar
- Line
- LineSymbols
- Spline
- Area
- AreaSpline
Supported Error Amounts
The errorAmount property specifies the meaning of the value property. Use any of the following error amount definitions:
- FixedValue: The value property represents the error as an absolute value.
- Percentage: The value property represents the error as a percentage.
- StandardDeviation: The value property represents the error as a number of standard deviations.
- StandardError: The error is the standard error of the mean (value property is not used).
- Custom: Error values are bound through the binding property or set to an object with 'plus' and 'minus' values.
Custom Error Amounts
Rather than setting a static value amount for all error bars, you can also provide custom error amounts within the data set and bind it to the ErrorBar series. This is done through the binding property or set to an object with 'plus' and 'minus' values.
Example:
import * as chart from '@grapecity/wijmo.chart';
import * as analytics from '@grapecity/wijmo.chart.analytics';

var errorBar = new analytics.ErrorBar();
errorBar.binding = 'amount,errorPlus,errorMinus';
errorBar.chartType = 'Column';
myChart.series.push(errorBar);
In this example, the bound data object has at least three fields: amount, errorPlus and errorMinus
Styling the Error Bars
Modify the error bars appearance by setting the errorBarStyle property to an object including SVG style attributes (stroke, strokeWidth). You can set the direction of the error bars by setting the direction property. You can also toggle the visibility of end-caps on the lines by setting the endStyle enum.
Example:
errorBar.direction = 'Both'; // 'Minus' or 'Plus'
errorBar.endStyle = 'NoCap'; // 'Cap'
errorBar.errorBarStyle = {
    stroke: 'darkred',
    strokeWidth: 3
  };