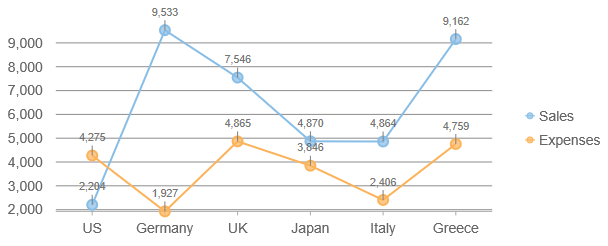
Data Labels in FlexChart
The dataLabels property allows you to show labels next to each data point on the chart.
To use it, set the following properties on the dataLabels object:
- content: String template with property holders, similar to the string used to define tooltip content. For example, '{value:n0}'.
- position: A LabelPosition value that determines where to place the labels relative to the data points.
- connectingLine: Whether to draw a line connecting the labels and corresponding data points.
- border: Whether to draw a border around the label.
- offset: The offset distance in points from the data point. This is commonly used with the connecting line.
FlexChart Example:
import * as wjChart from '@grapecity/wijmo.chart';

var myChart = new wjChart.FlexChart('#myChart');
myChart.dataLabel.content = '{value:n0}';
myChart.dataLabel.position = 'Top'; // Top, Left, Right, Center, Bottom, None
myChart.dataLabel.connectingLine = true;
myChart.dataLabel.border = true;
myChart.dataLabel.offset = 10;

Data Label Content
When the label content is a string, it can contain any of the following placeholders:
- seriesName: Name of the series that contains the data point (FlexChart only).
- pointIndex: Index of the data point.
- value: Value of the data point.
- x: x-value of the data point (FlexChart only).
- y: y-value of the data point (FlexChart only).
- name: Name of the data point.
- propertyName: any property of data object.
The parameter must be enclosed in curly brackets, for example 'x={x}, y={y}'. Additionally, bound field names can be included like '{country}' and '{item.otherData}'.
Example:
// Create a chart and show y data in labels positioned above the data point.
 var myChart = new wjChart.FlexChart('#myChart');
 myChart.initialize({
     itemsSource: data,
     bindingX: 'country',
     series: [
         { name: 'Sales', binding: 'sales' },
         { name: 'Expenses', binding: 'expenses' },
         { name: 'Downloads', binding: 'downloads' }],
 });
 myChart.dataLabel.position = 'Top';
 myChart.dataLabel.content = '{country} {seriesName}:{y}';
For a more complex data label layout, that can include mixed formatting, use additional tspan elements within the content. The following example applies bold to some text and changed color of value.
myChart.dataLabel.content =
 '<tspan font-weight="bold">{country}</tspan>' +
 '<tspan fill="red">:{value:n0}</tspan>';
The content can also be specified as a function that takes a HitTestInfo object as a parameter. The next example shows how to set data label content using a function.
// Set the data label content
 myChart.dataLabel.content = function (ht) {
   return ht.name + ":" + ht.value.toFixed();
 }
FlexPie Data Labels
Data labels work the same for FlexPie as FlexChart and FlexRadar, however the available positions are unique for a radial pie chart.
FlexPie Data Label Positions:
- Inside: The label appears inside the pie slice.
- Outside: The label appears outside the pie slice.
- Center: The label appears at the center of the pie slice.
- Radial: The label appears inside the pie slice and depends of its angle.
- Circular: The label appears inside the pie slice and has circular direction.
- None: A quick way to toggle the data labels visibility.
FlexPie data label example:
var myChart = new wjChart.FlexPie('#myChart');
myChart.dataLabel.content = '{value:n0}';
myChart.dataLabel.position = 'Outside';
myChart.dataLabel.connectingLine = true;
myChart.dataLabel.border = true;
myChart.dataLabel.offset = 10;
Custom Data Label Rendering
The data label content can also be customized within the rendering event. The data label rendering event args cancel property can be used to cancel the rendering for a particular data point, and the text property can be used to conditionally set the data label content.
Example:
// custom render labels only for the "downloads" series
myChart.dataLabel.rendering = function(s, e) {
    if (downloadsOnly && e.hitTestInfo.series.binding != 'downloads') {
        e.cancel = true;
        }
        e.text = 'nanana';
}
