5.20231.904
5.20231.904
Multiple Axes in FlexChart
Most charts have two axes, X and Y. This works well as long as all the data on the chart has the same nature and can share the same scale. But some charts contain series that show different types of data, with different units and scales. Plotting all the series against a single Y axis squeezes the first two series against the bottom of the chart.
The easiest way to solve this problem and still using a single chart is to create a secondary Y axis and assign it to the axisY property of the second series. Follow these steps to configure a second Y axis:
- Create new instance of Axis class and
- Configure its position, title, and other axis properties as needed.
- Assign the new axis to the series axisY property.
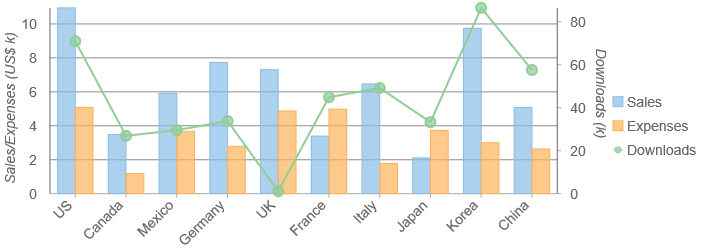
The chart example below has two series that represent amounts (sales and expenses) and one that represents quantities (downloads). The 'Downloads' series is plotted against a second Y axis.
import * as chart from '@grapecity/wijmo.chart';

// create and apply extra Y axis for 'Downloads' series
var axisY2 = new chart.Axis();
axisY2.position = 'Right';
axisY2.title = 'Downloads (k)';
axisY2.format = 'n0,';
axisY2.min = 0;
axisY2.axisLine = true;
myChart.series[2].axisY = axisY2;