Customizing Data Symbols
本主题中
Customizing the data symbols in your application enhances the presentation and understanding of the chart. FlexChart allows you to customize the data symbols using SymbolRendered event of the Series class.
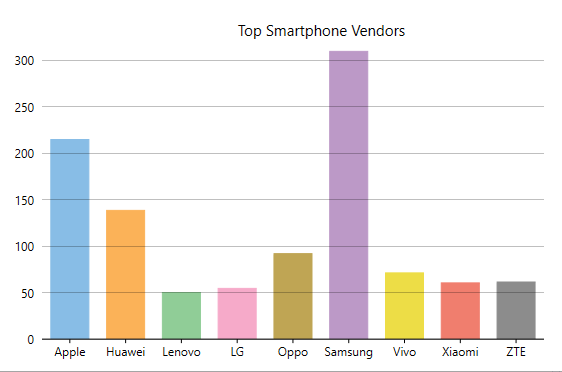
The image below shows each of point of a series in a different colour.

You can use the following code to customize the data symbols using SymbolRendered event.