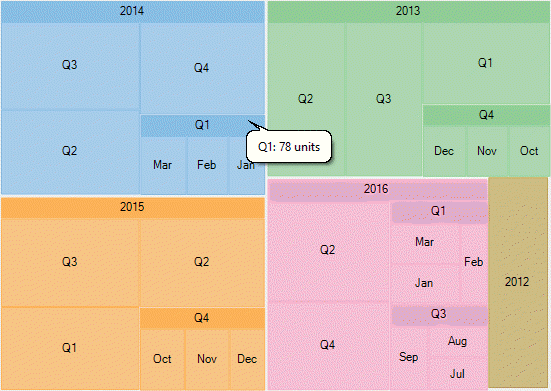
The TreeMap chart control binds to hierarchical data, to represent the elements of tree-like data as nested rectangles. Once the control binds to the data source and displays data items as rectangles, the size and color of these constituting rectangles enable analysis and comparison of data items.
FlexChartBase class exposes ItemsSource property, which takes collection of the objects, that contain data, to populate in tree map chart. The Binding and BindingName properties are instrumental in generating rectangular nodes for data items and their respective categories or groups. While Binding property takes string value depicting the name of the property of data item that contains numeric data value, helpful in calculating the size of rectangular nodes, BindingName takes string value depicting the name of data items. ChildItemPath property ensures that a hierarchical structure of the provided data collection is maintained, by communicating to the control about the child items within the data.
To elaborate how data is populated in a tree map chart, let’s consider a use case where we try to compare yearly sales (in units sold) of a multi-brand retail store. The analysis can then further be drilled down to quarters in a year and then to months in a quarter, by using Treemap chart. Here yearly sales are represented by the top level rectangles, quarterly sales in those years represent the subsequent level, and monthly sales form the next level that is leaf nodes in tree map.
The following image illustrates sales in a retail store, in terms of units sold, through TreeMap chart control. Note that the image shows hierarchical data up to third level, that is months in respective quarters of the years.

In this example, data generated in DataService class is serving as the source for tree map chart.
-
Create a hierarchical data source
- In the code view, create a DataService class to generate hierarchical data, as shown in the following code.
- Create a DataItem class to define list of objects to represent data items and their categories.
-
Bind TreeMap to the data source
To bind the TreeMap control to the data source use the following code.XAML 拷贝代码<Window xmlns="http://schemas.microsoft.com/winfx/2006/xaml/presentation" xmlns:x="http://schemas.microsoft.com/winfx/2006/xaml" xmlns:d="http://schemas.microsoft.com/expression/blend/2008" xmlns:mc="http://schemas.openxmlformats.org/markup-compatibility/2006" xmlns:local="clr-namespace:WpfTreeMapCS" xmlns:c1="http://schemas.componentone.com/winfx/2006/xaml" x:Class="WpfTreeMapCS.DataBinding" DataContext="{Binding RelativeSource={RelativeSource Mode=Self}}" mc:Ignorable="d" Title="DataBinding" Height="300" Width="300"> <Grid> <Grid.DataContext> <local:TreeMapViewModel /> </Grid.DataContext> <c1:C1TreeMap Binding="Value" BindingName="Year,Quarter,Month" ChildItemsPath="Items" ItemsSource="{Binding HierarchicalData}" MaxDepth="3"> <c1:C1TreeMap.DataLabel> <c1:DataLabel Content="{}{name}" Position="Center"> <c1:DataLabel.Style> <c1:ChartStyle/> </c1:DataLabel.Style> </c1:DataLabel> </c1:C1TreeMap.DataLabel> </c1:C1TreeMap> </Grid> </Window> -
Build and run the project
- Click Build | Build Solution to build the project.
- Press F5 to run the project.