Plot Area
本主题中
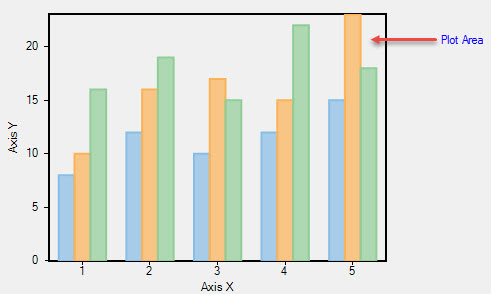
The Plot Area contains data plotted against X-axis and Y-axis.
In FlexChart, the Plot Area can be customized by using the PlotStyle property, which returns the ChartStyle object containing the following properties:
| Property | Description |
|---|---|
| Fill | Sets the fill brush. |
| Stroke | Sets the stroke brush. |
| StrokeDashArray | Sets the stroke dash array. |
| StrokeThickness | Sets the stroke thickness. |
In addition, FlexChart allows creating multiple plot areas that increase data visibility by displaying a single series in a separate plot area.
For more information about multiple plot areas, see Multiple Plot Areas.