FlexChart | ComponentOne
WPF FlexChart / Understanding FlexChart / WPF FlexChart Types / Line
本主题中
    Line
    本主题中

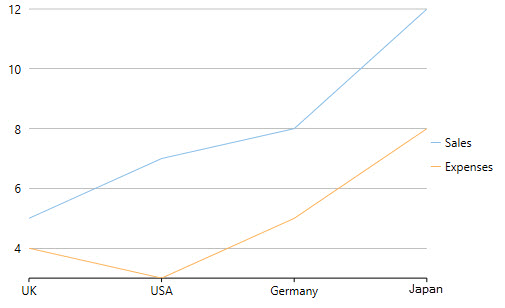
    The Line Chart displays trends over a period of time by connecting different data points in a series with a straight line. It treats the input as categorical information that is evenly spaced along the X-axis.

    You can create the Line Chart by setting the ChartType property to Line in XAML, at design-time, or using code.

    To create the stacking WPF Line Chart, you need to set the Stacking property to Stacked or Stacked100pc.

    WPF Line Chart

    WPF Line Chart

    Below is the code that implements the aforementioned example:

    <c1:C1FlexChart x:Name="flexChart" 
                    BindingX="Country" 
                    ItemsSource="{Binding DataContext.Data}" 
                    ChartType="Line">
        <c1:C1FlexChart.Series>
            <c1:Series SeriesName="Sales" 
                       Binding="Sales"/>
            <c1:Series SeriesName="Expenses" 
                       Binding="Expenses"/>
        </c1:C1FlexChart.Series>
    </c1:C1FlexChart>
    
    C#
    拷贝代码
    flexChart.ChartType = C1.Chart.ChartType.Line;