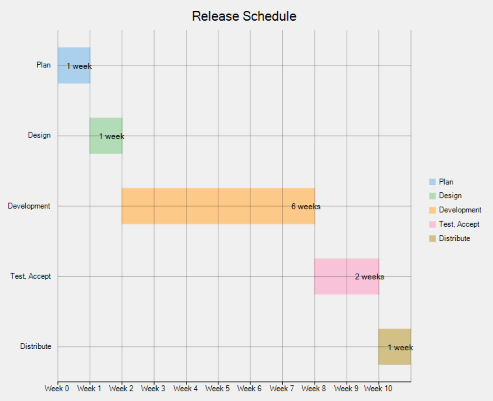
Gantt chart is a type of chart which is commonly used for planning and scheduling projects. It provides useful ways of showing activities that are displayed against time. The chart has a list of activities plotted on Y-axis while X-axis plots an appropriate time scale. Activities are represented using bars where position and length of the bars indicate the start time and duration of the activities respectively.
As primary purpose of a Gantt chart is planning and scheduling, it can be used for a range of projects and in various industries, such as construction, engineering, manufacturing, infrastructure, IT and more.
In FlexChart, Gantt chart can be implemented using the Series class. To begin with, create a new Series object and specify its properties. Then, use the SymbolRendering event provided by the Series class to plot activity bars on the chart and the LabelRendering event provided by the FlexChart class to display the labels.