FlexChart | ComponentOne
WPF FlexChart / Working with FlexChart / FlexChart Elements / FlexChart Axes Labels / Axis Grouping / DateTime Axis Grouping
本主题中
    DateTime Axis Grouping
    本主题中

    DateTime axis grouping is applicable in scenarios where the data displayed on the axis represents date time values. To implement date axis grouping in FlexChart, set the GroupProvider property to an object of the IAxisGroupProvider implementation.

    In the example code below, we have created a class DateTimeGroupProvider that implements the IAxisGroupProvider interface. The interface provides GetLevels method that returns the group levels and GetRanges method that returns the group ranges for a given level.

    Moreover, FlexChart allows you to set the group separator using the GroupSeparator property. Also, it allows you to expand or collapse group levels by setting the GroupVisibilityLevel property.

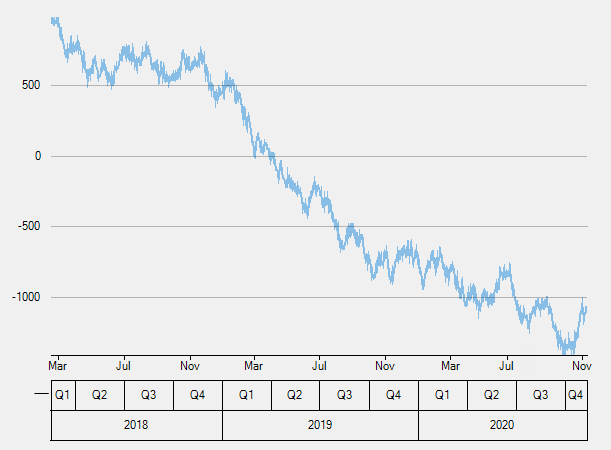
    The following image shows how FlexChart appears after setting the date axis grouping.

    DateAxisGrouping

    Add the following code in Index.xaml.

    拷贝代码
    <c1:C1FlexChart x:Name="flexChart" Background="White" ChartType="Line" BindingX="Time" 
                ItemsSource="{Binding Data}" Grid.Row="1" >
                <c1:Series Binding="Price"/>
                <c1:C1FlexChart.AxisX>
                    <c1:Axis GroupSeparator="Grid" GroupVisibilityLevel="1" Format="MMM"/>
                </c1:C1FlexChart.AxisX>
            </c1:C1FlexChart>
    
    拷贝代码
    public DateTimeAxisGrouping()
            {
                InitializeComponent();
                flexChart.AxisX.GroupProvider = new DateTimeGroupProvider();
            }
            public class DateTimeGroupProvider : IAxisGroupProvider
            {
                public int GetLevels(IRange range)
                {
                    return 2;
                }
    
                public IList<IRange> GetRanges(IRange range, int level)
                {
                    var timeRange = range as TimeRange;
                    if (timeRange == null)
                        return null;
                    var min = timeRange.TimeMin;
                    var max = timeRange.TimeMax;
                    var span = max - min;
    
                    List<IRange> ranges = new List<IRange>();
                    DateTime start;
                    if (level == 1)
                    {
                        start = new DateTime(min.Year, ((int)Math.Ceiling((double)min.Month / 3) - 1) * 3 + 1, 1);
                        ranges = Enumerable.Range(0, ((max.Month - start.Month) / 3 + 1) + 4 * (max.Year - start.Year)).Select(a => start.AddMonths(a * 3))
                       .TakeWhile(a => a <= max)
                       .Select(a => (IRange)(new TimeRange("Q" + (int)Math.Ceiling((double)a.Month / 3), a, a.AddMonths(3)))).ToList();
                    }
                    else
                    {
                        start = new DateTime(min.Year, 1, 1);
                        ranges = Enumerable.Range(0, max.Year - start.Year + 1).Select(a => start.AddYears(a))
                       .TakeWhile(a => a <= max)
                       .Select(a => (IRange)(new TimeRange(a.ToString("yyyy"), a, a.AddYears(1)))).ToList();
                    }
    
                    return ranges;
                }
            }