Bubble
本主题中
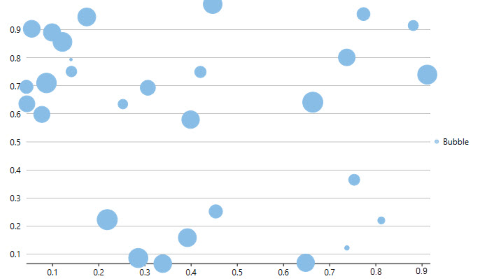
The Bubble Chart, which is basically a type of the Scatter Chart, is used for graphical representation of multi-dimensional data. It displays an additional data value at each point by changing its size. The chart type represents data points in the form of bubbles (data markers) whose X and Y coordinates are determined by two data values and whose size indicates the value of a third variable.
To create the WPF Bubble Chart, you need to set the ChartType property to Bubble either in the Properties window (at design-time) or code behind (at run-time). You can also set the same in XAML.
WPF Bubble Chart
Below is the implementation in code: