FlexChart | ComponentOne
WPF FlexChart / Understanding FlexChart / WPF FlexChart Types / Bar
本主题中
    Bar
    本主题中

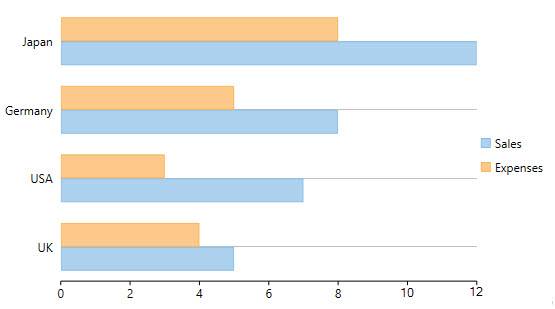
    The Bar Chart compares values across various categories or displays variations in a data series over time. The chart displays horizontal bars for data series plotted against X-axis and arranges categories or items on Y-axis.

    Set the ChartType property to Bar in the Properties window, in XAML, or in code to create the Bar Chart.

    To create the stacking WPF Bar Chart, you need to set the Stacking property either to Stacked or Stacked100pc.

    WPF Bar Chart

    WPF Bar Chart

    See the following code to implement the scenario:

    <c1:C1FlexChart x:Name="flexChart" 
                    BindingX="Country" 
                    ItemsSource="{Binding DataContext.Data}" 
                    ChartType="Bar">
        <c1:C1FlexChart.Series>
            <c1:Series SeriesName="Sales" 
                       Binding="Sales"/>
            <c1:Series SeriesName="Expenses" 
                       Binding="Expenses"/>
        </c1:C1FlexChart.Series>
    </c1:C1FlexChart>
    
    C#
    拷贝代码
    flexChart.ChartType = C1.Chart.ChartType.Bar;