FlexChart | ComponentOne
WPF FlexChart / Understanding FlexChart / WPF FlexChart Types / Area
本主题中
    Area
    本主题中

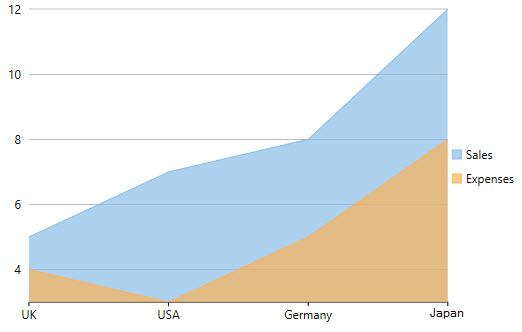
    The Area Chart depicts change in data over a period of time. It represents data series by connecting data points against Y-axis and filling the area between the series and X-axis. In addition, the chart displays data series in the same order in which they are added—back-to-front.

    To create the WinForms Area Chart, you can set the ChartType property to Area in the Properties window or in XAML. Or you can also set the same programmatically.

    In addition, you can set the Stacking property to Stacked or Stacked100pc to create the stacking Area Chart.

    WPF Area Chart

     WPF Area Chart

    The following code implements the above-mentioned scenario:

    <c1:C1FlexChart x:Name="flexChart" 
                    BindingX="Country" 
                    ItemsSource="{Binding DataContext.Data}" 
                    ChartType="Area" 
                    Margin="0,0,74,0">
        <c1:C1FlexChart.Series>
            <c1:Series SeriesName="Sales" 
                       Binding="Sales"/>
            <c1:Series SeriesName="Expenses" 
                       Binding="Expenses"/>
        </c1:C1FlexChart.Series>
    </c1:C1FlexChart>
    
    C#
    拷贝代码
    flexChart.ChartType = C1.Chart.ChartType.Area;